Scenario Based Power BI Questions
1. How to merge year 2021 and 2022 in first table
-> Will create a column having value =1 and will use merge query - LEFT OUTER JOIN and will expand the table and take only Year column
2. Count of Nick Name “Chotu” in the table and also % of total of Chotu
DAX 1 –
Count of Chotu = CALCULATE(COUNT(Sheet1[Nick Name]), SEARCH(“Chotu”,Sheet1[Nick Name],1,0))
DAX 2 –
% of chotu = DIVIDE([Count of Chotu], Countrows(Sheet1)).
Change into % from general
3. Deloitte: Import the 3 csv excel files from the folder into power bi and append it
-> Use directly folder to import it will get automatically append and want to add another file into the data then move that file into the same folder and just refresh the data.
4. TCS: Make the default value of sales to India without selecting India as a filter.
-> Dax:
Measure =
Var a = SELECTEDVALUE(Sheet1_table[Country] = “India”)
Var b = CALCULATE(SUM(Sheet1_table[Total Sales]), Sheet1[Country] = a)
Return b
5. Calculate business operations days between two dates
-> Dax:
Net working days =
Var a = SELECTEDVALUE(Sheet1_table[Order Date])
Var b = SELECTEDVALUE(Sheet1_table[Delivered Date])
Var c = NETWORKDAYS(a,b)
Return c
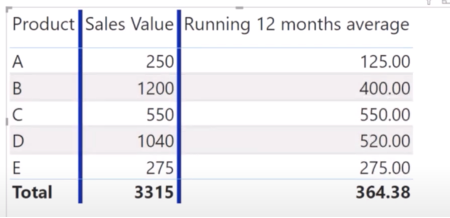
6. Rolling 12 months average sales of products
-> Dax –
Running 12 months average =
CALCULATE(AVERAGE(Sheet1_table[Sales Value]), DATEINPERIOD(Calendar_table[Date]),MAX(Calendar_table[Date] -12,MONTHS))
7. EY: Based on RankX
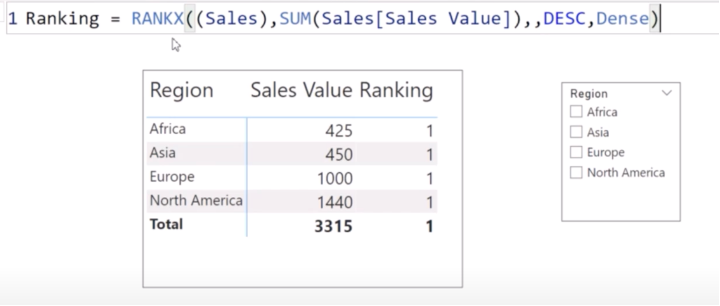
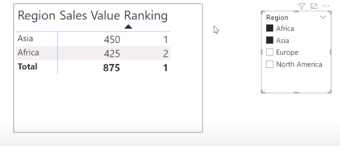
Correct the ranking dax
-> DAX:
Dax1: Total Sales = SUM(SALES_table[Sales Value])
Dax2: Ranking = RANKX(ALLSELECTED(SALES_table[REGION]), [Total Sales]),,DESC,Dense)
8. Starting sales from April to March (Fiscal Year)
è Dax: create a column in calendar table
New Month no =
IF(Calendar_table[Month no] < 3, Calendar_table[Month no] – 3, Calendar_table[Month no] + 9)
Then sort the Month column based on New Month no column
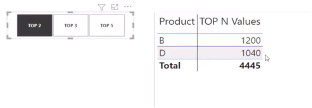
9. How to show Top N Dynamic Values
è Dax:
Dax1:
Ranking = RANKX(ALL(Sales_table[Product]), [Total Sales],,DESC,Dense)
DAX2:
TOP N Value =
Var selected_top = SELECTEDVALUE(Top Product[Value])
Var top_product =
SWITCH(selected_top,
“TOP 2”, IF([Ranking] <= 2, [Total Sales],
“TOP 3”, IF([Ranking] <= 3, [Total Sales],
“TOP 5”, IF([Ranking] <= 5, [Total Sales],
[Total Sales])
Return top_product
10. Calculate the Running/Cumulative total for the Month/Year
-> Dax:
Running Total = CALCULATE(SUM(Sales_table[Sales value]), FILTER(ALL(Calendar_table),Calendar_table[Date] <= MAX(Calendar_table[Date])))

11. What is the difference between below functions

-> TOTALYTD – Evaluates the year-to-date value of the expression in the current context
- It takes 2 arguments = TOTALYTD(<Experession>,<dates>)
-> DATESYTD – Returns the table that contains a column of dates for the year to date, in the current context
- It takes 1 argument that is date
-> Dax: we can do both
Dax1 - Total YTD value = TOTALYTD([Total Sales], DATESYTD(Calendar_table[date])).
Without using TOTALYTD - using Calc -
Dax2 - Total YTD using calc = CALCULATE([Total Sales], DATESYTD(Calendar_table[date])).
We will get same result

12. Accenture: Correct the Dax

-> Dax –
Measure = CALCULATE(COUNTROWS(Sales_table), Filter(Sales_table,[Total Sales] > 500))
13. Optimize Dax

-> Dax
Measure = SELECTEDVALUE(Sales_table[country])
14. Which function is helpful to connecting 2 tables if it is not connected directly.


-> Dax:
Sales amt required = CALCULATE(SUM(Sales_table[Sales Value]), TREATAS(VALUES(Calendar_table[Year]), sales_table[Year]))
15. Restrict the Total YTD as last order date of sales_table

-> Dax:
How to cal Total YTD: TOTALYTD([Sales Value], Calendar_table[Date])
Main Dax:
Total ytd restricted =
Var max_order_date = Max(sales_table[order_date])
Var total_ytd_restricted = TOTALYTD([Total Sales], Calendar_table[Date], Calendar_table[Date] <= max_order_date)
Return total_ytd_restricted
16. Capgemini: First not blank value column
-> Dax: COALESCE

17. Capgemini: Dynamic Title
-> Dax:

18. Create Index based on 2 columns
-> Dax:

19. TOTALYTD value without using time intelligence function

Same for MTD and QTD
20. Calculate last year month wise sales
-> Dax1: DATEADD
Last year month wise sales = CALCULATE([Total Sales], DATEADD(Calendar_table[Date],-1,Year))

-> Dax2: PARALLELPERIOD
Last year month wise sales = CALCULATE([Total Sales], DATEADD(Calendar_table[Date],-1,Year))

21. Diff Between

-> Values() – considered the blank value from the column
-> Distinct() – Ignore the blank value
22. Calculate in stock and out of stock inventory
-> Dax: using WINDOW function
Inventory Output =
Var demand = CALCULATE([DEMAND], WINDOW(1, ABS, 0, REL, ALLSELECTED(Inventory[Week])))
Var Supply = CALCULATE([Supply], WINDOW(1, ABS, 0, REL, ALLSELECTED(Inventory[Week])))
Return
IF(demand > supply, “OutOfStock”, “InStock”)
23. Indicate the maximum and minimum point on the line chart using measure
-> Dax: for Max
Max Value =
Var max_data_point = MAXX(ALL(‘table’),(Total Sales]))
Var check_max = IF(max_data_point = [Total Sales], max_data_point, Blank())
Return check_max
-> Dax: for Max
Min Value =
Var Min _data_point = MINX(ALL(‘table’),(Total Sales]))
Var check_Min = IF(Min_data_point = [Total Sales], Min_data_point, Blank())
Return check_Min
24. Calculate rank on the basis of two columns
-> Dax:
Rank =
Var max_state = MAX(‘table’[state])
Var final_rank = RANKX(FILTER(ALL(‘table’), ‘table’[state] = max_state), [Total Population], , DESC, Dense)
Return final_rank
25. Correct the total orders value of categories
-> Dax:
Correct total orders = IF(HASONEVALUE(Product_table[CategoryName]), [Total Orders], SUMX(Product_table, [Total Orders]))






0 Comments